Marketing: Data Visualization for SEO
Introduction
The Importance of Data Visualization in Marketing and SEO
In today’s digital world, data is everywhere. But raw numbers can be overwhelming and hard to understand. This is where data visualization comes in! By transforming complex data into visual formats like charts and graphs, you can make information clearer and more engaging. In marketing and SEO, effective data visualization helps you communicate insights quickly, capture attention, and improve user experience. When done right, it not only enhances your content but also boosts your search engine rankings. Let’s dive deeper into how data visualization plays a crucial role in marketing strategies.
Understanding Data Visualization
What is Data Visualization?
Data visualization is the graphical representation of information or data. It uses visual elements like charts, graphs, maps, and infographics to help people understand trends, patterns, and insights from complex datasets. Instead of sifting through pages of numbers or text, viewers can grasp key points at a glance through visuals.
Key Components of Effective Data Visualization
For data visualization to be effective, several components are essential:
- Clarity: The visual should convey information clearly without confusion.
- Relevance: Use visuals that relate directly to the message or insight being shared.
- Aesthetics: A visually appealing design attracts attention and keeps users engaged.
- Accuracy: Ensure the data represented is correct; misleading visuals can harm credibility.
By focusing on these components, you can create impactful visuals that enhance understanding.
The Role of Data Visualization in SEO
How Visuals Enhance User Experience
Visuals play a significant role in improving user experience on websites. When visitors encounter engaging graphics or infographics instead of plain text, they are more likely to stay longer on your page. This increased engagement signals to search engines that your content is valuable—potentially boosting your rankings.
Impact on Engagement Metrics and Bounce Rates
Engagement metrics such as time spent on page and bounce rates are vital for SEO success. High-quality visualizations encourage users to interact with your content rather than leaving immediately after arriving (which contributes to high bounce rates). For instance, articles with relevant images receive 94% more views than those without them! Thus, incorporating effective visuals can lead to better engagement metrics overall.
Types of Data Visualizations for SEO
Charts and Graphs
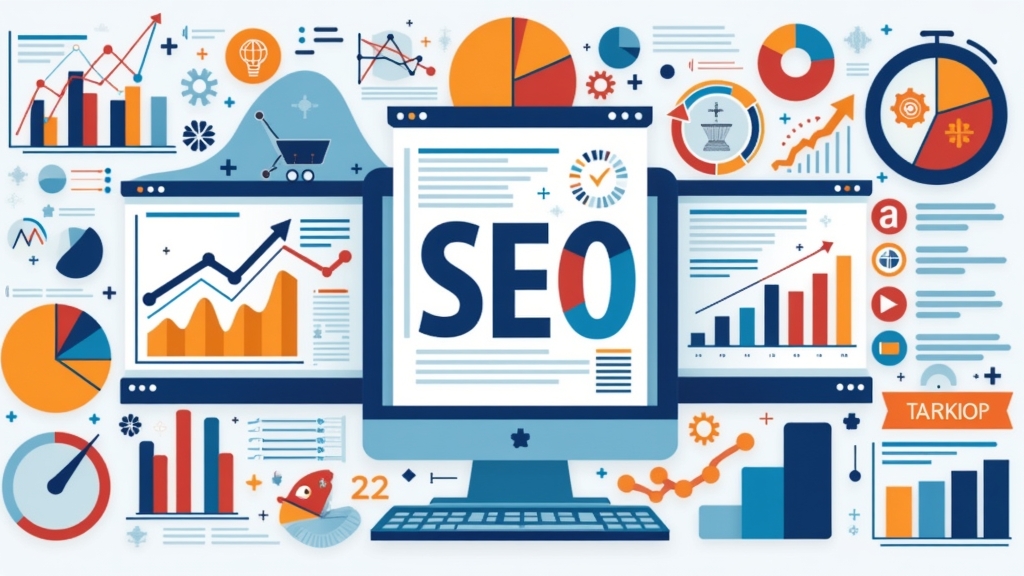
Charts and graphs are among the most common forms of data visualization used in marketing. They simplify numerical comparisons by displaying trends over time or differences between categories clearly. Bar charts work well for comparing quantities across different groups while line graphs show changes over periods effectively.
Infographics
Infographics combine images with informative content to tell a story visually. They are great for summarizing complex topics into digestible pieces that readers find easy to share on social media platforms—enhancing visibility!
Heatmaps
Heatmaps provide an intuitive way to visualize user behavior on websites by showing areas where visitors click most frequently. This insight helps marketers optimize their layouts based on actual usage patterns—leading towards improved conversions!
Tools and Software for Creating Data Visualizations
Popular Tools for Marketers
There are many tools available today that help marketers create stunning visualizations effortlessly:
- Tableau: Known for its powerful analytics capabilities.
- Google Data Studio: Free tool ideal for creating interactive dashboards.
- Canva: Great for designing infographics with ease.
These tools cater to various skill levels—from beginners needing simple designs to advanced users requiring detailed analytics features.
Comparison of Features and Usability
When choosing a tool for creating visualizations consider factors like usability (how easy it is), integration options (can it connect with other software?), pricing (is it within budget?), and customization capabilities (how flexible is the design?). Each tool has its strengths depending on specific needs—so choose wisely!
Best Practices for Using Data Visualization in SEO Strategies
Choosing the Right Type of Visual
Selecting the appropriate type of visual depends heavily upon what you’re trying to convey! For example:
- Use bar charts when comparing different categories.
- Opt for line graphs when illustrating trends over time.
Understanding which format works best will ensure clarity in communication!
Ensuring Accessibility and Clarity
Always prioritize accessibility when designing visuals! Make sure colors contrast well so everyone—including those who may have color blindness—can interpret them easily! Additionally:
- Keep text minimal but informative.
- Provide alternative descriptions if necessary so all users benefit from your content equally!
Implementing these practices ensures everyone engages positively with your visuals while enhancing their overall experience online!
Case Studies: Successful Use of Data Visualization in Marketing Campaigns
Examples from Leading Brands
Several leading brands have successfully utilized data visualization within their marketing campaigns:
- Spotify Wrapped: Every year Spotify presents personalized listening stats using vibrant infographics—a fun way that encourages sharing!
- Airbnb’s Community Center Dashboard: This platform showcases host statistics through interactive maps making it easier for hosts worldwide!
These examples highlight how creative use leads not only towards increased engagement but also brand loyalty among customers!
Lessons Learned from Effective Implementations
From these case studies we learn two important lessons:
- Engaging storytelling through visuals captures audience interest significantly better than plain facts alone!
- Personalization resonates deeply; tailoring experiences makes users feel valued—and thus more likely return again later down-the-line!
Conclusion
The Future of Data Visualization in Marketing and SEO
As technology continues evolving rapidly alongside consumer preferences shifting towards instant gratification—the future looks bright indeed! With advancements like AI-driven analytics emerging daily—it’s clear integrating innovative approaches remains critical moving forward! Embracing new techniques will empower marketers everywhere harnessing maximum potential out there waiting just beyond reach…
📢 Explore More: Continue Your Journey!
If this article helped you understand how important data visualization is in marketing strategies check out The Power of Infographics! It covers tips on creating compelling infographics that engage audiences effectively while enhancing understanding further!









![NEEWER 55W 18"/45cm Ring Light Kit [New Version], 5600K Dimmable ...](https://m.media-amazon.com/images/I/414QLqvZWLL._AC_.jpg)


